
City comparison · Southeast Valley
Chandler vs. Mesa, AZ: side by side
Mesa costs less and is much larger; Chandler costs more and has the lower sales tax. In October 2026 the median single-family home sold for $480,000 in Mesa, down from $500,000 a year earlier, and $539,000 in Chandler, down from $575,000. Both share the Loop 202 and a border, so the choice often comes down to price, taxes and the specific neighborhood.
By Wes Bender, licensed since 2014 (Arizona license SA653234000) · Bender Group AZ, Done Deal Brokerage · Updated November 20, 2026
Is Mesa cheaper than Chandler? Yes, for single-family homes. The October 2026 median sale price was $480,000 in Mesa and $539,000 in Chandler. Mesa also had more sales (289 versus 154). Chandler’s combined sales tax is 7.8%, lower than Mesa’s 8.3%.
Side by side
How do Chandler and Mesa compare?
Every figure below is dated and sourced. Market figures are single-family homes only; Census figures are five-year survey estimates, so they trail today’s prices.
| Fact | Chandler | Mesa |
|---|---|---|
| Population | 278,748 (Census estimate, July 1, 2025) | 513,656 (Census estimate, July 1, 2025) |
| Area and county | 66 square miles of incorporated area in Maricopa County, on the Pinal County line; founded 1912 (City of Chandler) | 138 square miles in Maricopa County; incorporated July 15, 1883 (City of Mesa) |
| Median single-family sale price | $539,000 in October 2026 ($575,000 in October 2025), ARMLS | $480,000 in October 2026 ($500,000 in October 2025), ARMLS |
| Median days to contract / months of supply | 39 days / 3.5 months (October 2026; actives as of Nov 18, 2026) | 48 days / 4.2 months (October 2026; actives as of Nov 18, 2026) |
| Sales with a seller concession (Oct. 2026) | 54.5% of sales (median $12,180) | 61.9% of sales (median $10,710) |
| Closed sales (Oct. 2026) / active listings (Nov. 18) | 154 / 551 | 289 / 1,237 |
| Median owner-occupied home value | $507,800 (Census ACS 2020–2024; Maricopa County $452,800) | $408,000 (Census ACS 2020–2024; Maricopa County $452,800) |
| Median gross rent | $1,902 (Census ACS 2020–2024) | $1,620 (Census ACS 2020–2024) |
| Mean travel time to work | 23.9 minutes (Census ACS 2020–2024) | 24.7 minutes (Census ACS 2020–2024) |
| Combined sales tax (retail) | 7.8% (Arizona and Maricopa County 6.3% + City of Chandler 1.5%) | 8.3% (Arizona and Maricopa County 6.3% + City of Mesa 2.0%) |
| 2026 property tax rate | About $7.45–$8.27 per $100 of assessed value, by school-district tax area | About $6.68–$8.86 per $100 of assessed value, by school-district tax area |
| City or town property tax rate (2026) | Primary $0.21, secondary $0.87 per $100 | Primary $0.00, secondary $0.85 per $100 |
| Utilities | Water, wastewater and solid waste: City of Chandler. Electric and gas: confirm the provider for each address | Water, wastewater and trash: City of Mesa. Electric: City of Mesa near downtown, otherwise confirm by address. Gas: City of Mesa in its service areas |
| Public school districts | Maricopa County’s tax areas inside Chandler cover Chandler Unified, Gilbert Unified, Kyrene Elementary with Tempe Union High, and Mesa Unified (check the district for each address) | Maricopa County’s tax areas inside Mesa cover Mesa Unified, Gilbert Unified, Higley Unified, Queen Creek Unified, and Tempe Elementary with Tempe Union High (check the district for each address) |
Price
Which costs more, Chandler or Mesa?
Mesa’s October 2026 median single-family sale price was $480,000, down from $500,000 in October 2025. Chandler’s was $539,000, down from $575,000 (our October 2026 market report (ARMLS)).
Chandler homes moved faster: a median 39 days to go under contract and 3.5 months of supply, versus 48 days and 4.2 months in Mesa. Concessions were common in both: 54.5% of Chandler sales (median $12,180) and 61.9% of Mesa sales (median $10,710). Mesa had the larger market, with 289 closed sales and 1,237 active listings, versus 154 sales and 551 actives in Chandler.
Taxes
How do property and sales taxes compare?
Property tax. The City of Mesa levies no primary property tax and a 2026 secondary (bond) rate of $0.85 per $100. The City of Chandler’s 2026 rates are about $0.21 primary and $0.87 secondary (2026 levies). Combined 2026 rates run about $6.68–$8.86 per $100 in Mesa’s main school-district tax areas and about $7.45–$8.27 in Chandler (Maricopa County 2026 tax rates).
Sales tax. Chandler’s combined retail rate is 7.8% and Mesa’s is 8.3% (Arizona Department of Revenue).
See the full breakdowns in our Chandler and Mesa cost of living guides.
Homes
How are the homes and communities different?
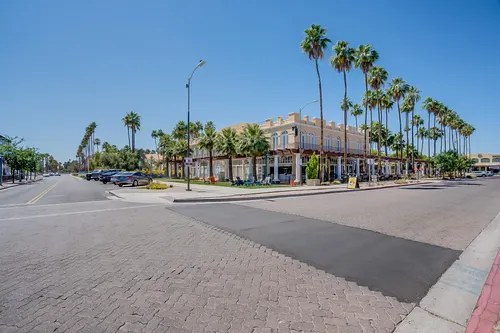
Chandler covers about 66 square miles and has a historic downtown under a 2.4-square-mile area plan (City of Chandler), lake and golf living in Ocotillo and Fulton Ranch, and 55+ choices such as Solera Chandler and nearby Sun Lakes.
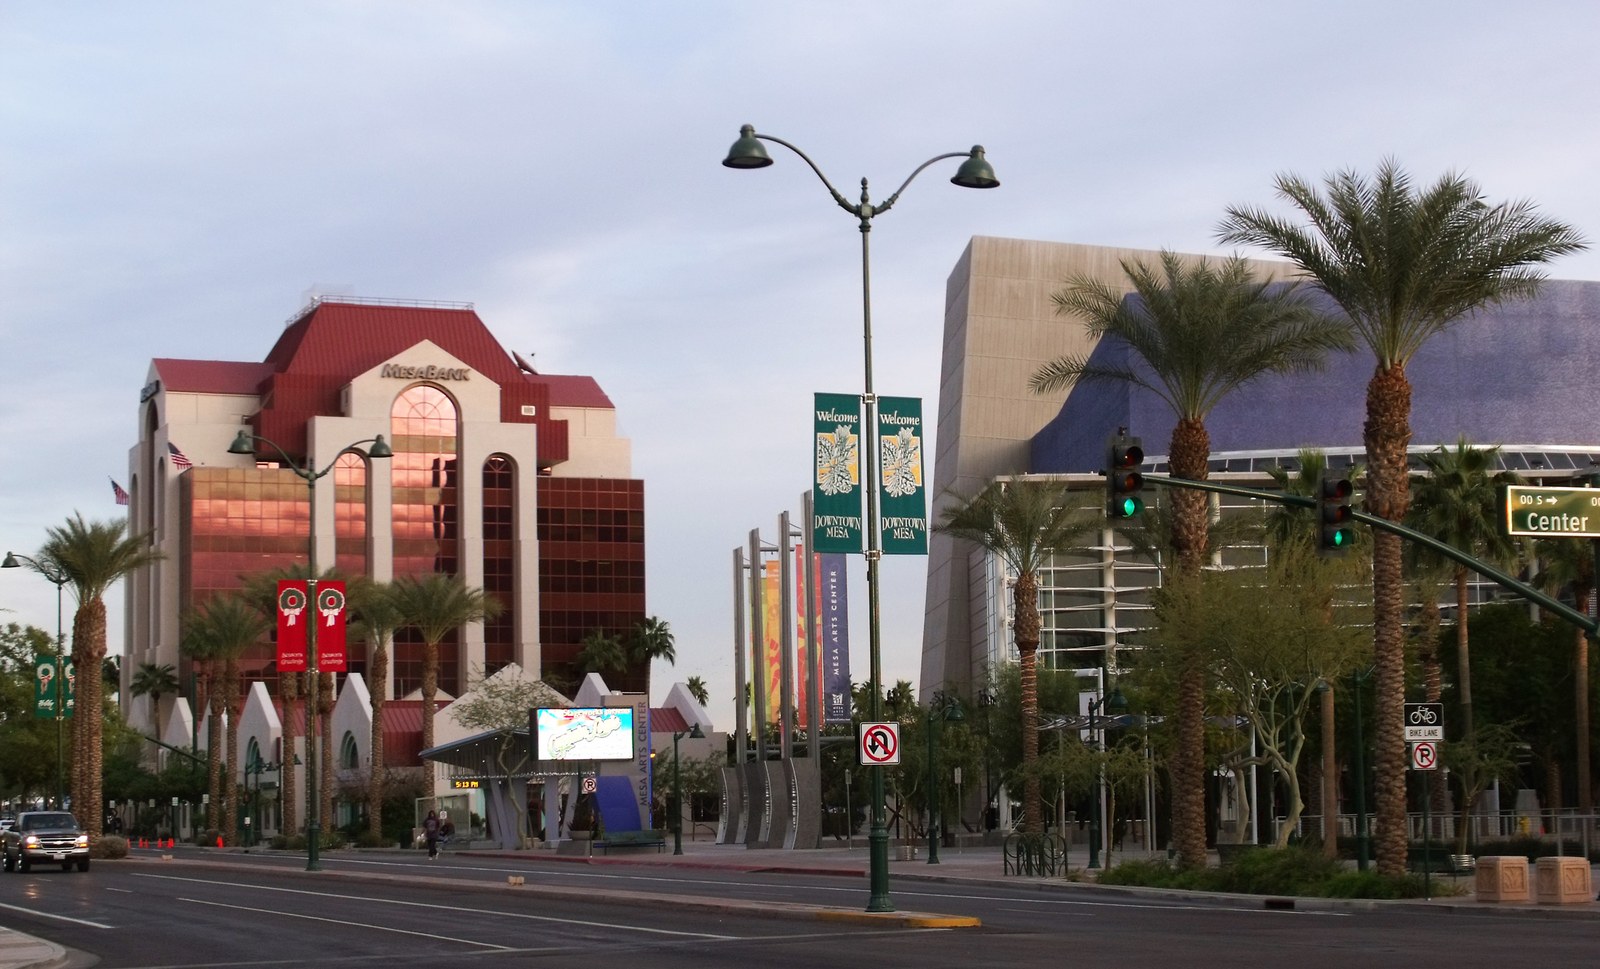
Mesa covers 138 square miles (City of Mesa) and runs from downtown and older central neighborhoods to newer planned communities such as Eastmark and Cadence at Gateway, plus hillside areas such as Las Sendas.
Community guides
Which communities should you tour first?
Chandler community guides
Fulton Ranch
520-acre Fulton Homes plan around a 28-acre lake system, with The Island custom homes.
Fulton Ranch guide →The Provinces
A Chandler planned community of 1,829 homes, established in 1984, between Knox, Ray, Cooper and Hamilton.
The Provinces guide →See every guide on the Chandler homes for sale and community guide.
Mesa community guides
Las Sendas
Foothill planned community with 3,400+ homes, trails, and a separate golf club.
Las Sendas guide →Mulberry
A Blandford Homes community in southeast Mesa, with a central park, pool, courts and clubhouse.
Mulberry guide →See every guide on the Mesa homes for sale and community guide.
Commute & daily life
Which has the shorter commute?
Chandler’s mean travel time to work is 23.9 minutes and Mesa’s is 24.7 (Census ACS). The Loop 202 Santan Freeway serves both, and Mesa also sits on Valley Metro light rail, which began running through Phoenix, Tempe and Mesa in 2008 (ADOT; City of Tempe).
Both share the same desert climate: NOAA’s 1991–2020 normals for Phoenix Sky Harbor put the average July high at 106.5°F, with about 111 days a year at or above 100°F (NOAA).
How to choose
Should you choose Chandler or Mesa?
- You want the lower median price and a larger market. Start in Mesa.
- You want the lower sales tax and a faster October 2026 market. Start in Chandler.
- You want a specific community. Compare the neighborhood, its HOA and its tax area first; the city line matters less than the address.
- You want to negotiate. Both had frequent seller concessions in October 2026; Mesa had more supply and a slightly slower pace.
Go deeper on each city: Living in Chandler: pros and cons, cost of living in Chandler, living in Mesa: pros and cons, cost of living in Mesa. Read what clients say on our reviews page.
Questions
Chandler vs. Mesa: FAQ
Is Mesa cheaper than Chandler?
Yes, for single-family homes. The October 2026 median sale price was $480,000 in Mesa and $539,000 in Chandler, based on ARMLS data in our market report. Both medians were down from October 2025.
Which has the lower sales tax, Chandler or Mesa?
Chandler. Combined retail sales tax is 7.8% in Chandler and 8.3% in Mesa.
How do property taxes compare in Chandler and Mesa?
It depends on the tax area. Combined 2026 rates run about $7.45 to $8.27 per $100 in Chandler and about $6.68 to $8.86 in Mesa’s main school-district areas. Mesa levies no primary city property tax; Chandler’s 2026 primary rate is about $0.21 per $100.
Which is larger, Mesa or Chandler?
Mesa. The City of Mesa says it covers 138 square miles, and the Census July 1, 2025 estimate is 513,656 residents. Chandler has about 66 square miles of incorporated area and a Census estimate of 278,748.
Which has the shorter commute?
Chandler, slightly. The Census puts mean travel time to work at 23.9 minutes in Chandler and 24.7 minutes in Mesa.

About the author
Wes Bender, Bender Group AZ
Wes Bender is the founder and lead agent of Bender Group AZ, brokered by Done Deal Brokerage. He has been licensed since 2014 (Arizona Department of Real Estate license SA653234000), and he and Lisa live in Gilbert and work across the East Valley. Wes and Lisa live in Gilbert and work daily in Chandler and Mesa, including Done Deal Brokerage’s Chandler office.
Sources
- Bender Group AZ, Phoenix Housing Market Report, October 2026: single-family closed sales from ARMLS via RealTalk HQ, queried Nov 17, 2026; active listings from the ARMLS snapshot dated Nov 18, 2026.
- U.S. Census Bureau, QuickFacts: Maricopa County, Pinal County, Phoenix, Gilbert, Chandler and Mesa (population estimates V2025; ACS 5-year 2020–2024).
- Maricopa County, 2026 Tax Rates (approximate residential primary and secondary rates per $100 by tax area).
- Maricopa County, Adopted Property Tax Levies and Rates, Fiscal Year 2027 (2026 tax levy).
- Arizona Department of Revenue, Transaction Privilege and Other Tax Rate Tables, effective Nov. 1, 2026.
- City of Chandler, Downtown Region Area Plan, Chapter 1.
- City of Chandler, Historic Preservation.
- City of Mesa, About Mesa.
- City of Mesa, Mesa History.
- Arizona Department of Transportation, Don’t get thrown for a loop (Loop 202 segments), Sept. 1, 2021.
- City of Tempe, Timeline of Tempe History.
- NOAA National Centers for Environmental Information, U.S. Climate Normals 1991–2020, Phoenix Sky Harbor (USW00023183).
Figures were checked against the sources above on November 20, 2026 and can change. Market figures are based on information from the Arizona Regional Multiple Listing Service (ARMLS) for October 1, 2025 through November 18, 2026; all information should be verified by the recipient and none is guaranteed as accurate by ARMLS. Listing information © 2026 ARMLS. City descriptions are general and are not a guarantee about any property or neighborhood. We do not rate schools; confirm school assignments with the district for each address.
Talk with us
Comparing homes in Chandler and Mesa?
We’ll pull recent sales, the tax bill, HOA dues and utility providers for the exact addresses you’re weighing, dated and sourced.
Bender Group AZ, Wes and Lisa Bender
Done Deal Brokerage, 698 N Iowa St, Chandler, AZ 85225